Metrics with the OpenTelemetry Collector
In this article we will look at using The OpenTelemetry collector to capture metrics emitted by a .NET application running in an Azure AKS cluster. The metrics will then be exported to Prometheus and viewed in Grafana
Requirements for this exercise
If you want to follow along and run the code referenced here you will need the following tools:
- .NET 7
- Visual Studio Community 2022
- Access to an Azure AKS cluster
- Helm
- Kubectl
.NET Configuration
OpenTelemetry Packages
The first thing we need to do is add the relevant OpenTelemetry packages to our project. These are:
- OpenTelemetry.Extensions.Hosting 1.60
- OpenTelemetry.Instrumentation.AspNetCore 1.60-rc.1
- OpenTelemetry.Instrumentation.Process 0.5.0-beta.3
- OpenTelemetry.Exporter.Console 1.60
- OpenTelemetry.Exporter.OpenTelemetryProtocol 1.60
Initialisation
After adding our packages, we next need to configure our telemetry options using the Application Builder. OpenTelemetry is a granular framework and consists of a number of different features which can be switched on or off. We need to specify which telemetry signals we wish to capture as well as specifying where the telemetry should be sent.
var builder = WebApplication.CreateBuilder(args);
const string serviceName = "relay-service";
string oTelCollectorUrl = builder.Configuration["AppSettings:oTelCollectorUrl"];

Action<ResourceBuilder> appResourceBuilder =
    resource => resource
        .AddDetector(new ContainerResourceDetector())
        .AddService(serviceName);

builder.Services.AddOpenTelemetry()
      .ConfigureResource(appResourceBuilder)
      .WithMetrics(metrics => metrics
          .AddAspNetCoreInstrumentation()
           .AddOtlpExporter(options =>
           {
               options.Endpoint = new Uri(oTelCollectorUrl);
               options.Protocol = OpenTelemetry.Exporter.OtlpExportProtocol.Grpc;
           })
          .AddConsoleExporter());

var app = builder.Build();
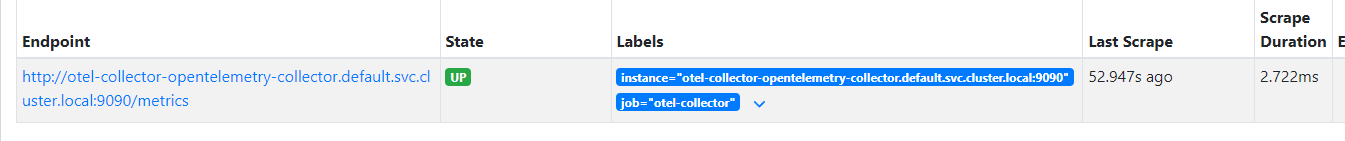
In the above code block, we have configured our EndPoint by passing in our 'oTelCollectorUrl'. Our Collector is running in the same cluster as the service so the url will look something like "http://otel-collector-opentelemetry-collector.default.svc.cluster.local:4317". GRPC is the default protocol for OpenTelemetry, although you can also use Http. As you can see from the lines below, once our application is deployed it will emit metrics signals to the OpenTelemetry Collector as well as to the Console.
.AddOtlpExporter(options =>
{
    options.Endpoint = new Uri(oTelCollectorUrl);
    options.Protocol = OpenTelemetry.Exporter.OtlpExportProtocol.Grpc;
})
.AddConsoleExporter());
Understanding the Output
If you run your application locally and look at the Debug output you will be able to view the actual telemetry being emitted to the Collector. You will see a stream of output with entries sduch as the following:
 (2024-01-06T18:21:06.1819700Z, 2024-01-06T18:22:06.1557673Z] http.request.method: POST http.response.status_code: 200 http.route: Relay/SendMessage network.protocol.version: 1.1 url.scheme: https Histogram
Value: Sum: 0.2956234 Count: 4 Min: 0.0233219 Max: 0.1224156
(-Infinity,0]:0
(0,0.005]:0
(0.005,0.01]:0
(0.01,0.025]:1
(0.025,0.05]:0
(0.05,0.075]:1
(0.075,0.1]:1
(0.1,0.25]:1
(0.25,0.5]:0
(0.5,0.75]:0
(0.75,1]:0
(1,2.5]:0
(2.5,5]:0
(5,7.5]:0
(7.5,10]:0
(10,+Infinity]:0
In case you are wondering what this means, here is a quick breakdown:
-
Time Range:
(2024-01-06T18:21:06.1819700Z, 2024-01-06T18:22:06.1557673Z)This obviously indicates the time range over which these measurements were taken. -
HTTP Request Metadata:
http.request.method: POSTspecifies that the HTTP request method was POST.http.response.status_code: 200indicates that the response status code was 200 - i.e. successful.http.route: Relay/SendMessagetells us the route or endpoint that was called isRelay/SendMessage.network.protocol.version: 1.1indicates the network protocol version used, which in this case is HTTP/1.1.url.scheme: httpsshows that the URL scheme used was HTTPS.
-
Histogram Data: This part shows the distribution of response times for the requests:
-
Value: Sum: 0.2956234 Count: 4 Min: 0.0233219 Max: 0.1224156gives a summary of the data:Sum: 0.2956234is the total of all the recorded times.Count: 4indicates that there were four measurements.Min: 0.0233219andMax: 0.1224156show the minimum and maximum response times, respectively.
-
The following lines represent the histogram bins, showing how many requests fell into each time range (in seconds):
(-Infinity,0]:0means no requests took less than or equal to 0 seconds.(0,0.005]:0means no requests took between 0 and 0.005 seconds.(0.005,0.01]:0and so on.(0.01,0.025]:1means one request took between 0.01 and 0.025 seconds.- This pattern continues, showing the distribution of response times in various ranges.
-
This histogram is useful for understanding the performance characteristics of your HTTP requests, such as how many are fast, moderate, or slow, based on the response time categories you've defined. The histograms are based on the default buckets defined in the OpenTelemetry SDK.